Population of yeovil
population of yeovil
Rapid twentieth century expansion
 Firstly,
it is important
to stress that
there is great
confusion over
the population
statistics of
Yeovil. The
figure usually
quoted is
'around 40,000'
but the
confusion arises
over which area
this figure
applies to. The
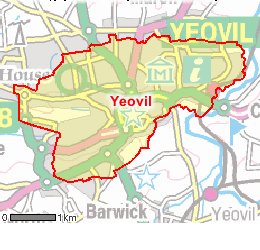
census figures
used here (as
provided by the Office
for National Statistics) are
for the Parish
of Yeovil which,
a quick glance
at the map at
left will show,
is probably not
what you were
thinking -
missing, for
example, is most
recent housing
at Abbey
Manor Park,
Brympton,
Houndstone, and
so forth. On the
other hand,
statistics used
by South
Somerset
District Council
note that in
2008 Yeovil’s
population was
recorded as
44,906 - based on an
all-inclusive
population that
incorporates the
populations of
Yeovil Without
and Brympton
within the urban area for Yeovil.
Which is all
well and good
until you want
to compare like-with-like
over the past
two centuries,
as I do here.
Firstly,
it is important
to stress that
there is great
confusion over
the population
statistics of
Yeovil. The
figure usually
quoted is
'around 40,000'
but the
confusion arises
over which area
this figure
applies to. The
census figures
used here (as
provided by the Office
for National Statistics) are
for the Parish
of Yeovil which,
a quick glance
at the map at
left will show,
is probably not
what you were
thinking -
missing, for
example, is most
recent housing
at Abbey
Manor Park,
Brympton,
Houndstone, and
so forth. On the
other hand,
statistics used
by South
Somerset
District Council
note that in
2008 Yeovil’s
population was
recorded as
44,906 - based on an
all-inclusive
population that
incorporates the
populations of
Yeovil Without
and Brympton
within the urban area for Yeovil.
Which is all
well and good
until you want
to compare like-with-like
over the past
two centuries,
as I do here.
So, having said all that, the 2011 census figures indicate that the parish of Yeovil had a total population of 30,378, comprising 14,850 males and 15,528 females.
For centuries the size of the town's population increased very little and occasionally, due to influences such as the plague and a number of devastating fires, actually decreased in size. Gradually, however, the population slowly increased, especially during the latter part of the eighteenth century as the gloving and leather industries took hold in the town. During the nineteenth century, as these expanding industries meant that the town prospered, the population increased even more rapidly, rising from 2,774 persons in 1801 to 11,704 a hundred years later.
Of course this comparatively sudden fourfold increase in Yeovil's population created all manner of problems such as a housing shortage, how to deal with the town's waste, where to bury the dead, the need for road widening (yes, even then) and so on. The urgent need for essential town improvements resulted in the enormous changes to the local governing corporation in the middle of the nineteenth century when Yeovil became a Municipal Borough in 1854. With hindsight it is possible to understand the significant and beneficial changes that were made to the town at this time.
Another concurrent affect on the town's population growth in the middle of the nineteenth century was the arrival of the railways, which revolutionised the town’s transport system and communication with the world beyond, while also changing forever its industry as new markets became viable. Hendford Terminus opened in 1853, Pen Mill Station in 1854, Yeovil Junction Station opened in 1860 and Yeovil Town Station opened in 1861.
Map
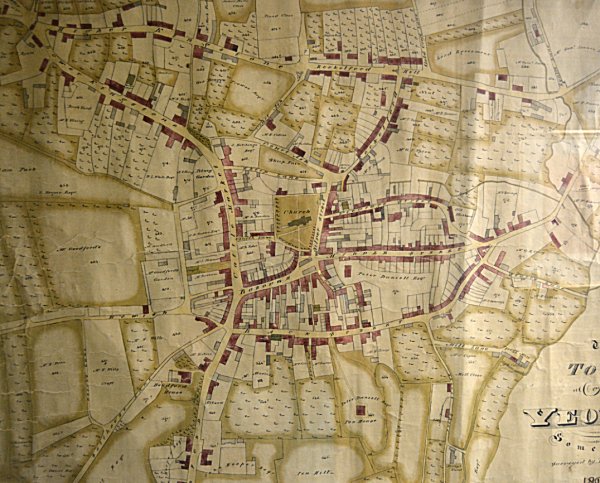
E Watts' map of Yeovil of 1806 shows that the only expansion of the town from the medieval up to this time was primarily along Kingston and Reckleford. This was chiefly because ownership of the lands to the immediate north of St John's church and south of South Street were in private ownership and precluded development.
Population growth charts
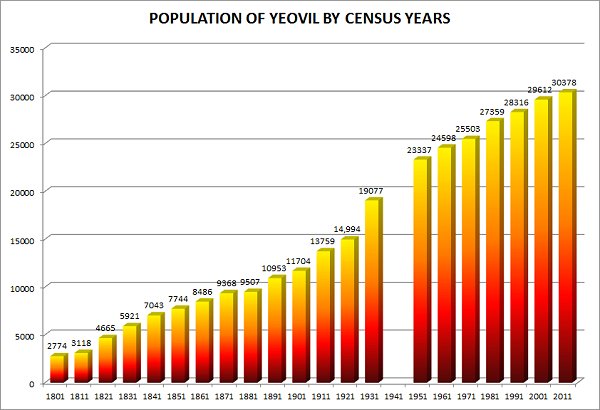
Graph showing the rate of growth of Yeovil over the last two centuries. The figures are for the parish of Yeovil and do not include Yeovil Without (for example 7,260 in 2001) or Brympton (5,268 in 2001). No census was undertaken during the Second World War. (Figures tabulated below).
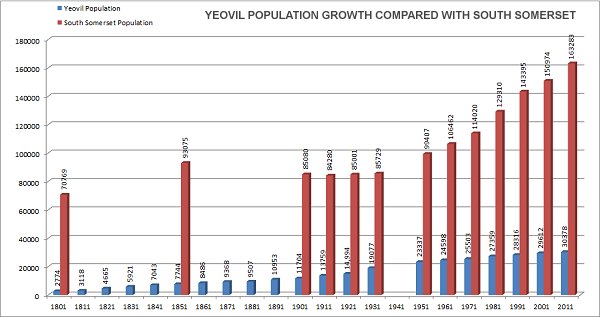
Compared with the sudden growth in the population of south Somerset as a whole following the Second World War (when no census was carried out), Yeovil's population expansion for the same period seems sluggish. (Figures tabulated below).
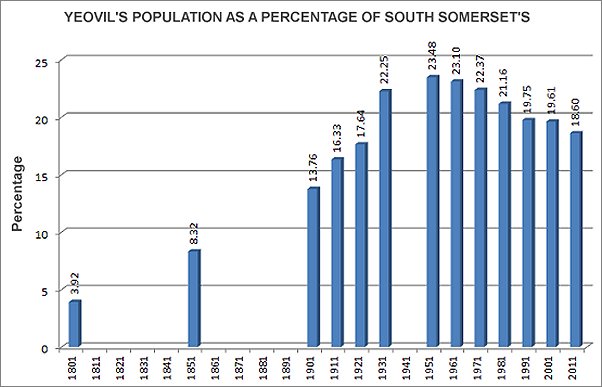
When compared to the whole population of south Somerset, it becomes clear that since the Second World War Yeovil's population has steadily decreased in comparison - perhaps caused chiefly by the rapid decline and eventual demise of the leather and gloving industries in Yeovil. (Figures tabulated below).
|
Census Year |
Population
of Yeovil Parish |
Population
of South Somerset |
Yeovil
as %age |
| 1801 | 2,774 | 70,769 | 3.92% |
| 1811 | 3,118 | Unknown | Unknown |
| 1821 | 4,665 | Unknown | Unknown |
| 1831 | 5,921 | Unknown | Unknown |
| 1841 | 7,043 | Unknown | Unknown |
| 1851 | 7,744 | 93,075 | 8.32% |
| 1861 | 8,486 | Unknown | Unknown |
| 1871 | 9,368 | Unknown | Unknown |
| 1881 | 9,507 | Unknown | Unknown |
| 1891 | 10,953 | Unknown | Unknown |
| 1901 | 11,704 | 85,080 | 13.76% |
| 1911 | 13,759 | 84,280 | 16.33% |
| 1921 | 14,994 | 85,001 | 17.64% |
| 1931 | 19,077 | 85,729 | 22.25% |
| 1941 | No Census | No Census | Unknown |
| 1951 | 23,337 | 99,407 | 23.48% |
| 1961 | 24,598 | 106,462 | 23.10% |
| 1971 | 25,503 | 114,020 | 22.37% |
| 1981 | 27,359 | 129,310 | 21.16% |
| 1991 | 28,316 | 143,395 | 19.75% |
| 2001 | 29,612 | 150,974 | 19.61% |
| 2011 | 30,378 | 163,283 | 18.60% |